Lost in the space between systems: Data quality in financial services

Week two of Beyond the Hype, a 12-week series from our CEO Charlie Symonds on what modern technology practically means for wealth managers and providers across financial services.
On 23 September 1999, after a journey of 286 days, NASA's Mars Climate Orbiter fired its engine to slip into orbit around Mars, passed behind the planet, and was never heard from again.
When the investigators went looking for the fault, they did not find a broken component or a bad decision made under pressure. They found a unit of measurement. The ground software that calculated the spacecraft's small course corrections was producing its figures in pound-force seconds, while every other part of the system read those figures as newton-seconds. The two differ by a factor of about 4.45, and nobody converted between them. [1]
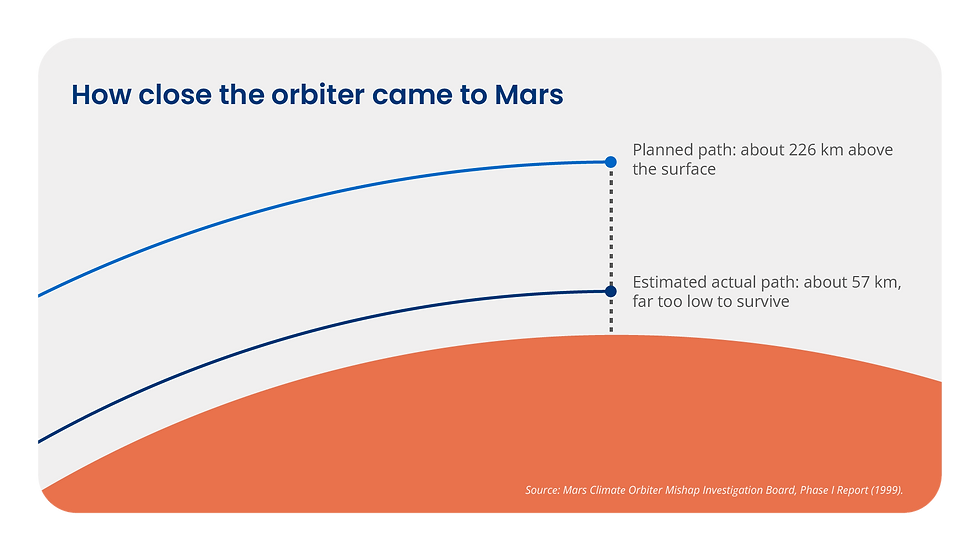
What makes the story worth telling is how quietly it went wrong. Each correction over nine and a half months of cruising nudged the orbiter a little further from where the navigation team believed it to be, and none of those nudges was large enough to be alarming on its own. The spacecraft should have arrived in an elliptical orbit around 226 kilometres above the surface. Corrected calculations afterwards put its actual approach at roughly 57 kilometres, far too low to survive. [1] The orbiter cost about $125 million. [2]
There were warnings. Odd-looking numbers in the navigation files had been noticed months earlier and talked about between colleagues, but never formally raised, and the investigation board concluded that they had eventually "slipped through the cracks". [1] NASA's associate administrator for space science put it plainly afterwards: people sometimes make errors, and what failed here was the systems engineering and the checks and balances that should have caught this one. [2]
Nobody entered a wrong number. Every team was working accurately in its own terms. The data was correct everywhere and untrustworthy overall, and that is a distinction the wealth and pensions industry is about to become very familiar with.

Last week's map, this week's units
Last week I wrote about Harry Beck, the draughtsman who redrew the London Underground in 1931 by throwing away the geography and drawing the connections instead. The point was that the track is already laid. Most firms can now reach the data they need, and the harder work is joining it up and keeping it consistent as the network grows.
This week is about what happens when you join up data you cannot trust, which is worse than not joining it up at all. A single customer view assembled from records that disagree does not resolve the disagreement. It hides it behind one confident screen.
The industry is about to be marked in public
By 31 October, every pension provider and scheme in scope must be connected to the pensions dashboards ecosystem and ready to receive find requests, search their records and return information. [3] That is 25 days from today.
Connection is the straightforward part. What dashboards actually do is take a record that has been kept quietly, and often carefully, for thirty years, and put it in front of the person it belongs to, in real time, alongside everyone else's.
The Pensions Regulator has a name for what that will expose. Data debt is its phrase for the build-up of quality problems that comes from years of underinvestment, and its research has found that one in four schemes still hold some data in non-digital form, while only half of those offering defined benefit pensions had recent value data for all members. [4] After engaging with hundreds of schemes, TPR also reported that fewer than three in five were confident in the accuracy of the common data they hold on their own membership. [5] Heywood's analysis of millions of member records suggested that nearly one in five dashboard requests could come back as a possible match rather than a clean one, which means a human being lands back in the middle of a journey designed to run without one. [6]
Advice firms are looking at the same fault line from the other side of it. NextWealth found 61% of firms only somewhat satisfied with the data platforms provide, with the largest gaps in transaction-level detail, firm-level management information and consistent formatting. [7] Consistency, again.
Data quality in financial services is a control, not a clean-up
Most firms treat data quality as a project. You do it before the migration, before the dashboard deadline, before the audit, and then you stop, which is exactly why it comes back. Quality is a property of the process that creates and maintains the data rather than of the data itself, so if nothing validates a national insurance number at the point of capture, no amount of cleansing will stop the next one going in wrong.
The useful thing about the pensions side of this market is that it has already agreed what good looks like. TPR's member data guidance points firms at the six core data quality dimensions defined by DAMA UK and used across government, and tells trustees to assess their data against them. [8] They travel well beyond pensions, and any advice firm could pick them up tomorrow.
Dimension | The question it answers | What it looks like when it is missing |
Completeness | Is it all there? | Blank fields that stop a match, a review or a suitability check |
Accuracy | Is it right? | A valuation will not reconcile to the platform |
Consistency | Does it agree across systems? | Two addresses, two spellings of a name, two answers to one question |
Timeliness | Is it current? | A value that was true at the last quarter end and is presented as today's |
Uniqueness | Is the customer in here once? | The same client counted twice, charged twice, contacted twice |
Validiity | Is it in the form everyone expects? | Free text where code should be, or units nobody agreed |
What I'm seeing
This section is my view, from the firms and providers I talk to, rather than the research.
Most of the data quality problems I come across were created at the point of capture. A form with no validation, a free-text field where a code belongs, a process that lets someone save an incomplete record because the client is waiting: these are small, sensible-feeling compromises that then get inherited by every system downstream. Cleansing treats the symptom and leaves the cause in place, which is why firms find themselves doing it again three years later.
The second pattern is that the work leaves the building. A reconciliation runs in a spreadsheet, a calculation someone built in 2019 is still executed by hand every month, a valuation is adjusted before it goes out. End-user computing is where the trusted record quietly stops being trusted, because the logic sits on one desktop, nobody tests it, and the person who wrote it has usually moved on.
Providers carry a version of this that advisers rarely see. The same customer can sit in three parts of the business at once, with a modern product on one administration system, a legacy product on a closed-book platform, and a book of policies maintained on a spreadsheet more often than anyone likes to admit. Dashboards now ask all of those systems the same question at the same moment.
Advice firms have their own constraint, which is that getting your own data out is harder than it should be. Some established adviser systems make extraction slow, partial or expensive, and that stops being an IT irritation the moment you are asked to evidence the outcomes your clients received. We will come back to that properly later in the series.
Consolidators inherit all of it in one go. Six acquired firms mean six versions of every client and six sets of habits at the point of capture, and moving everyone onto one CRM does not reconcile any of it. It puts the disagreement onto a single screen, which is not the same as resolving it.
None of this is dramatic, and that is the point. Nobody notices a slow drift until the burn.
The decision that costs nothing
Underneath all of it sits a decision that most firms have never formally made, which is that for any given fact about a customer, one system has to be right.
The valuation. The address. The vulnerability flag. The ongoing fee and the service it pays for. Somebody has to name the authoritative source for each, write it down, and say what happens when two systems disagree. That decision costs nothing and changes a great deal, because it tells you what to validate, what to reconcile, what to fix first, and who owns it when it breaks.
Most firms skip it and buy a tool instead, which is easier and more visible, and which is why the problem survives each new tool. It is also why this article sits where it does in the series. Trusted data and organisational context, the rules and definitions your business actually runs on, are the two preconditions for everything that follows. Neither works without the other. Rules acting on a record that holds two answers will pick one of them, confidently, and at speed.
Good rules on bad data give you a faster wrong answer.
Questions people are asking
What is data quality in financial services, and how do you measure it?
It is the degree to which data can be relied on for the decisions you make with it, measured across dimensions such as completeness, accuracy, consistency, timeliness, uniqueness and validity. [8] You measure it by testing samples of the records behind your most important journeys against those dimensions, then tracking the result over time. One overall score tells you very little, whereas a trend by dimension on the data that matters tells you where to spend.
What is a system of record?
It is the source treated as authoritative for a particular fact, rather than for everything. A platform may be the system of record for holdings, the back office for advice history, the provider for policy terms. The problems start not when systems disagree, which they always will, but when nobody has said which one wins.
How do I fix duplicate customer records?
Merge them once, then stop creating them. Deduplication without validation at the point of capture simply resets the clock, and uniqueness is the dimension most likely to embarrass you in public, because it produces two letters, two fee lines and two versions of the same person on a dashboard.
Do I need a data platform to get a single customer view?
Not always. A large provider with millions of policies and a legacy estate probably does need serious infrastructure. Many advice firms and mid-sized providers can reach a trusted, joined-up view by deciding the system of record for each fact and building a consistent layer over the systems they already have, which is what we are covering tomorrow.
We can already acess the data. Why is this still hard?
Because access and agreement are different things. Every connection you add gives you another version of the customer, so without an agreed standard for what is true, more data produces more disagreement rather than less. The orbiter had all the data it needed.
The client's side
A client never experiences a data quality problem as such. They experience a letter addressed to someone who died in March, a statement carrying last quarter's value, a dashboard that cannot find a pension they know they hold, or a vulnerability they disclosed once and have to explain again to someone who should already know.
Each of those is a small withdrawal from an account that is not financial, and it is drawn down at exactly the moments, retirement and bereavement among them, when a family is deciding whether to stay.
Who is doing it well
The most useful development here is not happening inside any one firm. It is the industry agreeing what things mean before it exchanges them.
The Pensions Dashboards Programme data standards, TPR's matching guidance and PASA's data matching convention together do something this market has rarely done, which is to define the facts and the tolerances up front. Schemes and providers must choose a matching approach based on the quality of the data they actually hold, document it, and treat possible matches as an operational process rather than a nasty surprise. [9] TPR has reinforced that by consolidating its guidance and pressing trustees to treat member data as a strategic asset rather than an administrative chore. [5]
That is the opposite of the orbiter. Agree the units first, then exchange the numbers.
What this means for you
If you run an advice firm:
You cannot evidence outcomes on data you do not trust. Take the five facts you would need for any client review, decide which system is authoritative for each, then measure how often they agree. A fortnight of that will teach you more than a year of system selection.
If you are a product provider:
Dashboards have converted your internal data debt into a customer-facing experience, so match rates and possible-match volumes are now service metrics as well as compliance ones. The same customer sitting across your modern, legacy and spreadsheet books is your own single-view problem, not just your advisers'.
If you are a consolidator:
The synergy case depends on reconciling six versions of every client, so agree the system of record before the migration rather than after it. Otherwise you industrialise the disagreement and call it integration.
In plain English: Data quality
Data quality is how far your data can be relied on for the decisions you make with it. It has dimensions, and the six most commonly used are completeness, accuracy, consistency, timeliness, uniqueness and validity. It is created at the point of capture and eroded by everything that happens afterwards, which is why it is maintained like a control rather than delivered like a project. The test is not whether the data looks tidy on screen. It is whether two systems, asked the same question, give you the same answer.
One thing to do this week
Take one client or member, ask three systems for the same five facts, and count the disagreements.
Then come and talk about what to do next. Tomorrow, Wednesday 7 October, 12:30 to 13:30, I am joined by Poppy Achilles and by Stuart Coleman of Tetmon for Addressing the Single Customer View Challenge, where we will look at how a single, trusted view of your data and the analytics that sit on it can be built at a level of investment a mid-sized firm can carry.
The orbiter was not lost because anyone was careless. It was lost because several teams were confident, and nobody checked the space between them.
Check the space between them.
Sources
NASA Safety Center, System Failure Case Studies, "Lost In Translation", August 2009, drawing on the Mars Climate Orbiter Mishap Investigation Board Phase I Report (10 November 1999). Ground software produced figures in pound-force where newton-seconds were specified, a factor of 4.45; planned insertion orbit 226km above the surface against an estimated actual approach of about 57km; anomalies discussed informally and never resolved. https://sma.nasa.gov/docs/default-source/safety-messages/safetymessage-2009-08-01-themarsclimateorbitermishap.pdf Phase I Report in full: https://llis.nasa.gov/llis_lib/pdf/1009464main1_0641-mr.pdf
CNN, "Metric mishap caused loss of NASA orbiter", 30 September 1999, for the $125 million figure, the 286-day journey and the NASA statement on systems engineering and checks and balances. Archived copy: https://nces.ed.gov/pubs2009/metadata/exhibit1_1.asp
FCA, Pensions dashboards: how to connect to the ecosystem. Providers of relevant pension schemes must be registered, connected and compliant with COBS 19.11 by 31 October 2026 at the latest. https://www.fca.org.uk/firms/pensions-dashboards-ecosystem-connect TPR equivalent for occupational schemes: https://www.thepensionsregulator.gov.uk/en/trustees/contributions-data-and-transfers/dashboards-guidance
The Pensions Regulator, "Don't miss your dashboards deadline over a 'data debt'", July 2025. One in four schemes hold some data in non-digital form; only half of schemes offering DB benefits had recent value data for all members. https://blog.thepensionsregulator.gov.uk/2025/07/24/dont-miss-your-dashboards-deadline-over-a-data-debt/
The Pensions Regulator, "Trustees urged to get dashboards-ready by treating member data as a strategic asset", 2025. Fewer than three in five schemes confident in the accuracy of their common data; revised member data guidance consolidating expectations. https://www.thepensionsregulator.gov.uk/en/media-hub/press-releases/2025-press-releases/trustees-urged-to-get-dashboard-ready
Heywood, "Pensions Dashboards: planning for possible matches", analysis of millions of member records suggesting nearly one in five dashboard requests could result in a possible match. https://heywood.com/publications/post/thinking-about-possible-matches
NextWealth, Data Openness Report 2026, survey of 201 financial advisers. 61% only somewhat satisfied with platform data; largest gaps in transaction data, firm-level MI and consistent formatting. https://www.moneymarketing.co.uk/news/advisers-turn-to-aggregators-as-platforms-fall-short-on-data/
The Pensions Regulator, Assessing member data quality, which directs trustees to the six core data quality dimensions defined by DAMA UK. https://www.thepensionsregulator.gov.uk/en/trustees/contributions-data-and-transfers/scheme-member-data-quality/assessing-member-data-quality
The Pensions Regulator, Matching people with their pensions, on setting matching criteria based on data quality and resolving data issues before connection, read alongside PDP data standards and PASA data matching convention guidance. https://www.thepensionsregulator.gov.uk/en/trustees/contributions-data-and-transfers/dashboards-guidance/matching-people-with-their-pensions


